The Mapping Lab
The Mapping Lab develops computational methods and AI technologies for the future of education. We model complex educational systems at scale, tracking, predicting and responding to dynamic changes across time. We aim to achieve real world impact across the educational spectrum, including K-12, two-year and four year pathways. We welcome educational partners to deploy cutting-edge research in real-world experiments.
Founded at MIT by Professor Karen Willcox in 2015, the Mapping Lab is now based at UT Austin's Oden Institute, and continues to support MIT- and Oden-based educational tools in addition to active new projects developing educational technologies.
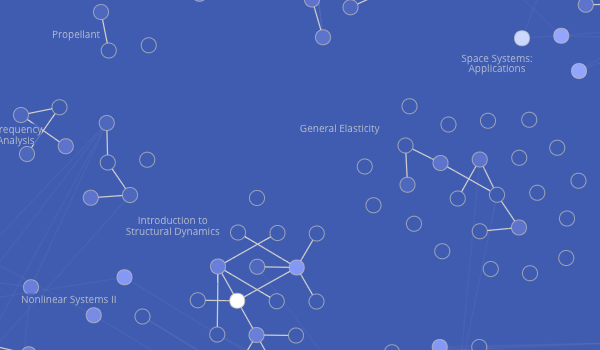
Network Maps
Network maps represent complex relationships. They support scalable graph-based analytics. Example: interactive curriculum mapping and analytics.
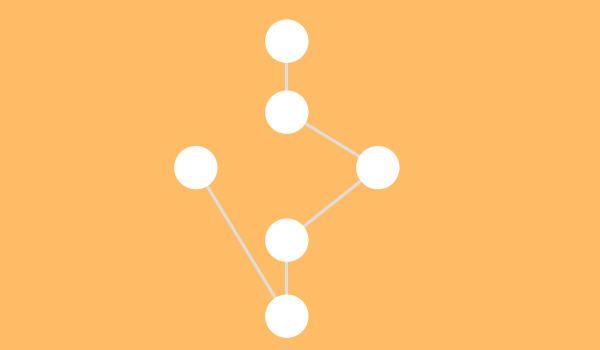
Tree Hierarchy
Tree models represent pathways through learning entities. Example: pathways through granular learning outcomes for adaptive learning systems.
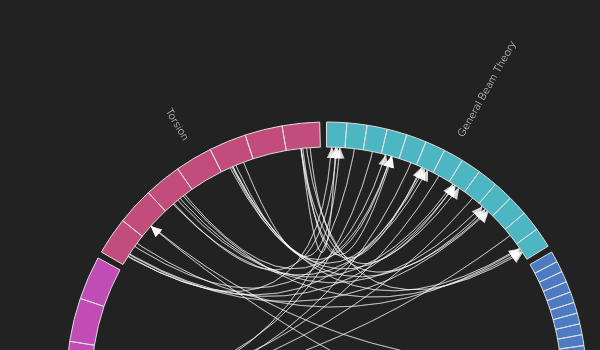
Chord Diagrams
Chord diagrams emphasize relationships across entities at multiple scales. Example: relationships among learning outcomes across a curriculum.
Digital maps have changed our lives. Whether we are searching for directions from place A to place B, searching for nearby restaurants, analyzing traffic, or just browsing the map to get the lay of the land, digital maps provide us with rich visual, informative, interactive experiences.
Navigating the modern educational landscape shares many parallels: Learners are often trying to get somewhere (e.g., a job, a certification, or a set of marketable skills). They may want to know what topics or skills are “nearby”. They may want to know what kind of roadblocks to expect along the way. It is hard to imagine navigating the physical world without a map, yet every day learners navigate the educational world mapless.
Network
Map
In the modern era of digital technology and big data, an educational map could and should be a richer visual, interactive experience. At the Mapping Lab, we create scalable models of educational data and we create the technologies that extract insights and value from these models. Our models mathematically represent the relationships among the data. Our models manifest as structured data sets that can feed other applications: analytics, interactive visualization, dynamic analysis, and more.
Tree
Hierarchy
The Mapping Lab research is built on scalable and extensible technology. To see our most popular by request source code, visit Xoces.js, an interactive nested chord visualization library.